


Hedgefundie's Excellent Adventure, Scaled Down
Lol 2022.

[NOTE: I no longer endorse the totality of this post! In particular, I think long-duration US treasuries are currently a poor idea primarily because my views on AI imply a very high growth rate on the rest of the economy, which will have effects on interest rates.]
obligatory disclaimer that this isn't financial advice and that I don't know shit about fuck, being as I am a dog on the internet.
So the most impressive Bogleheads forum thread of all time is a 250-someodd-page magnum opus picking apart, backtesting, deconstructing, reconstructing, and arguing heatedly about the Hedgefundie’s Excellent Adventure investment strategy. You’ll note this thread is actually part 2. Part 1 weighs in at a comparatively dainty 60 someodd pages.
What Hedgefundie Is, For The Uninitiated
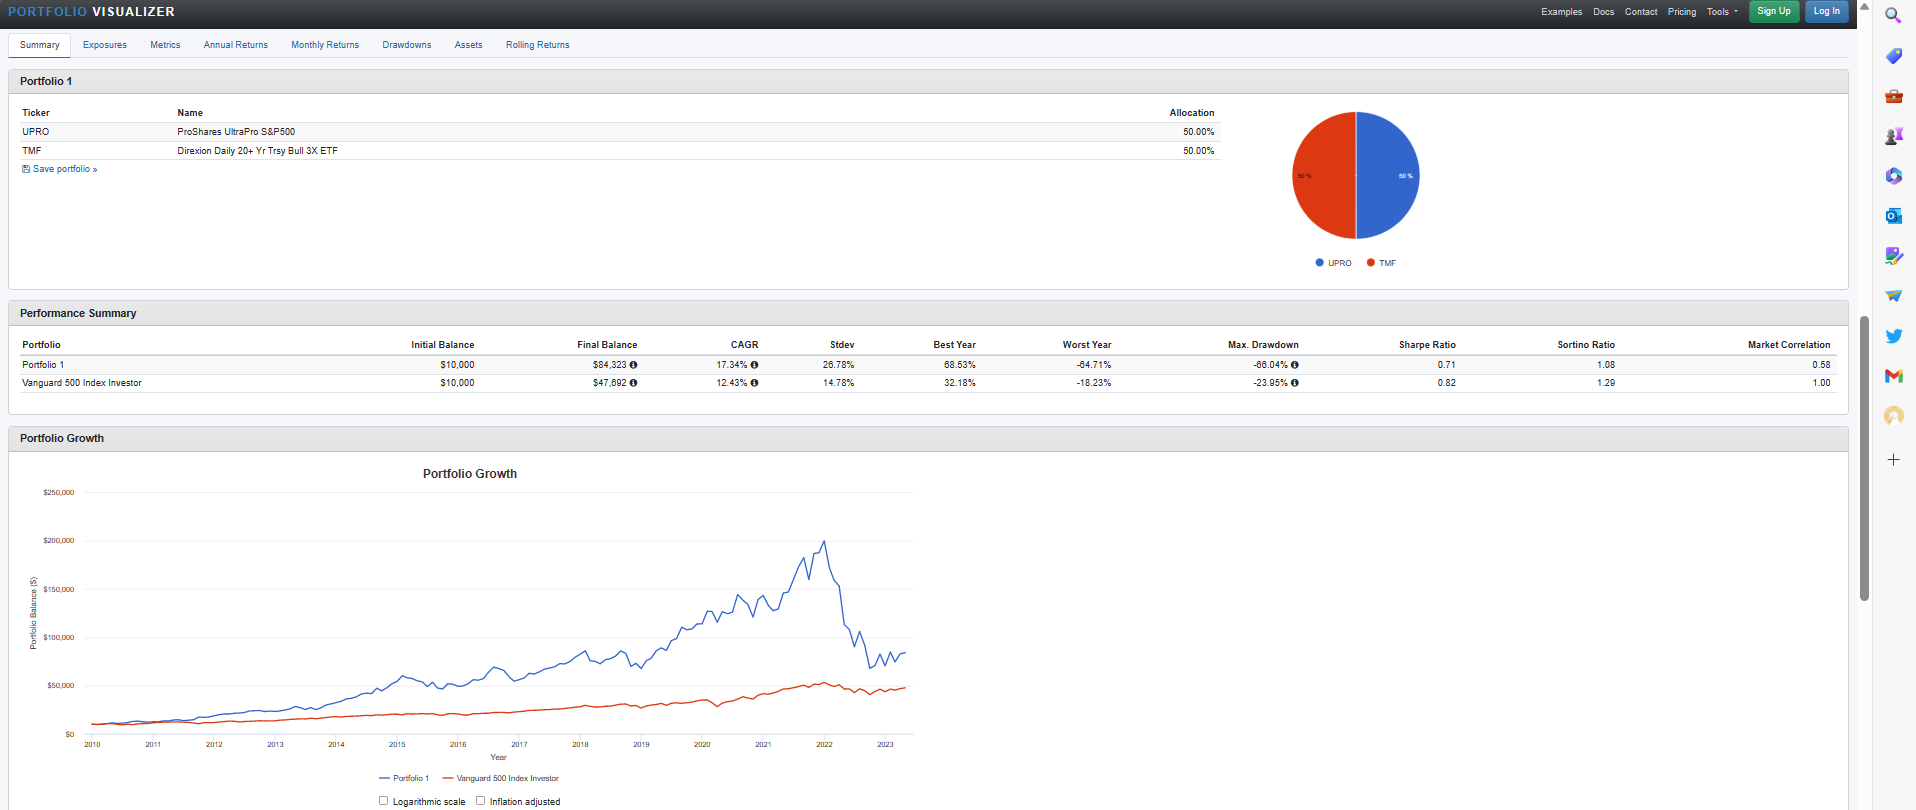
It’s pretty basic, really: it’s just taking your bog-standard S&P 500 and long-term treasuries setup and levering it 3x using handy leveraged ETFs vended out by Proshares and Direxion, respectively. It did spectacularly from 2010-2022, weathering market downturns without a sweat and returning a staggering 30% CAGR, which is to say, buckets of money.

Which was great! Smooth as butter, riiiiight up until 2022 when everyone involved lost their shirt. Like so:

What happened, of course, was that treasuries are the flight-to-safety asset when bad shit happens around the world, which meant that everything was cool whenever stuff like a mortgage crisis would hit since it would result in TMF skyrocketing even as UPRO plummeted, and vice-versa when times are good. Interest rates were declining and there was a near-constant stock bull market, so yeah, things were very good.
And then the Treasury jacked up interest rates, causing the entire thing to collapse since for that brief window of like… a year…. treasuries and stocks were very positively correlated downwards.
Now, I would invite you to notice that even though the drawdowns are absurdly eye-watering for HFEA in 2022, even taking this into account it still actually does return buckets of money historically if you measure from 2010 or therabouts. Buuuuuut.
This Was All Predictable, And Was Predicted

So, the brilliant minds at Bogleheads developed a spreadsheet where they attempted to rig up simulated leveraged ETF returns going back to the fifties. I have a copy right here, where I’ve messed with it to simulate various wacky investment schemes :
https://docs.google.com/spreadsheets/d/1EbQq1zm3F1sy18fj0OsxrVxaCO9iK1Qh/edit?usp=sharing&ouid=104101085617379899852&rtpof=true&sd=true
Note the graphs are super-wonky and I’m pretty sure the Portfolio Beta calculations are fucked. Also, by messing around with it on my phone I managed to mess up the formatting so it’s inconsistent between percentages and decimal. IGNORE ALL THAT. Here’s the important bits:


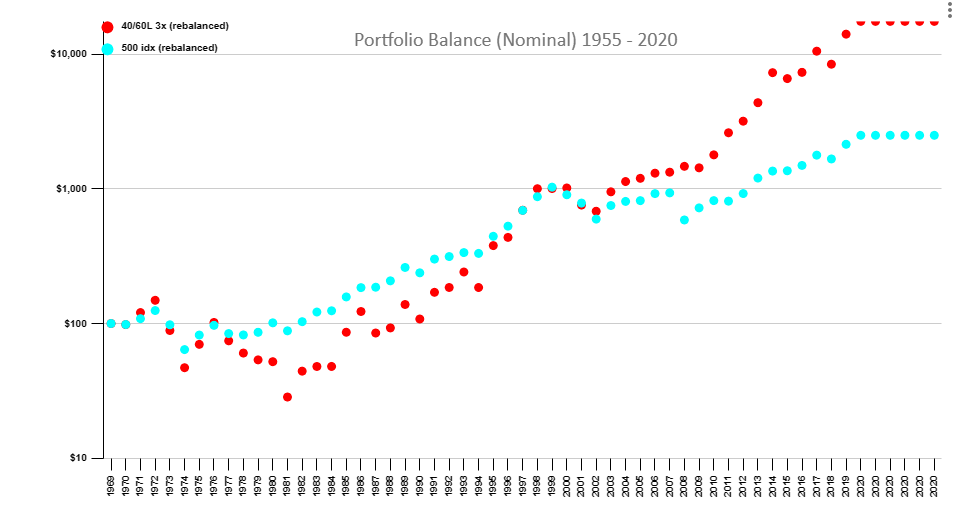
Also ignore the legend in the second graph, the red dots are Hedgefundie and the blue is the S&P 500.
Takeaway: the Hedgefundie portfolio got roasted in the 70’s despite doing well at other time periods. Which makes sense, really: the 70s was a time period of rising interest rates (hammers TMF), stagnation (hammers UPRO), and inflation (hammers TMF since bonds are, of course, denominated in US dollars).

So clearly we’ve got some issues, here. What we want is a forever portfolio, one that can be held forever across time periods for performance that exceeds the S&P 500 with lower volatility. I would really prefer to also not endure >50% drawdowns.
Q: Wait, what’s the theoretical basis for thinking that’s even possible? Doesn’t this violate the EMH?
(I have further thoughts on the Efficient Markets Hypothesis, but that can come later.)
Not so! One way of thinking of stock market returns is that you are being rewarded for being the bearer of risk. However, note that the market only rewards undiversifiable risk. If you go all-in on Honest Joe’s Car Emporium, your risk-adjusted returns will be trash because you took on a bunch of risk you didn’t have to.
This is where, without leverage, we’d get a bit stuck. It’s well-known that you can get better risk-adjusted returns than just 100% all-in on the S&P 500 by diversifying between the S&P 500 and treasury bonds, since those assets are mostly uncorrelated in most time periods. To put another way: for each unit of risk you take on (for various definitions of “unit of risk”), you’re getting more returns (in terms of compound-adjusted growth rate at the end of time.) However, your total returns— your actual growth rate— is better just going all-in on the S&P 500.
This implies that if you were able to take a blend of the S&P 500 and Treasuries, and then somehow lever them up so that the return profile matched the S&P 500, you’d still end up with less risk. The flies in the ointment are are twofold!
(A) borrowing costs
(B) LETF expense ratios
Borrowing costs tend to be pretty close to the short-term treasury rate of return (justifiable since the swaps on which the LETFs operate are broadly equivalent to taking out a loan for, like, a day and then paying it back at the end of the day). LETF expense ratios hover around 1% for the most part, which they justify via the fact that for a retail investor 1% plus “whatever the short-term borrowing costs are” is way the hell better than you’re going to get elsewhere. For reference, right now Fidelity’s offering me margin rates at like 11% interest. Which: I cannot think of a situation where that would be justifiable.
Suffice it to say, LETFs are the cheapest leverage you can get as a retail investor.
Q: These LETFs apparently use “swaps” to simulate the 2x or 3x index movement day to day. How do swaps work?
Hell if I know.
Q: Wait, seriously? Isn’t it irresponsible to invest in a product you don’t really understand?
Way I figure it, understanding always bottoms out somewhere. The mechanics of precisely how financial clearinghouses and settlement of transactions work are also mysteries to me. However, I see ample evidence in my daily life that these interfaces are basically solid— that they represent a contract (“your deposited funds will be available in a couple days“) that’s really all I demand of it, and for that reason I accept my ignorance as unproblematic.
And as far as LETFs go, I have found nobody arguing against the basic premise that they do in fact deliver on their promise of their stated multiple of the underlying index. They appear to be stable financial instruments, and though they are vulnerable to counterparty risk, my expectation is that these risks would be things along the lines of “there is a banking crisis and everybody is fucked” or, more troublingly, “somebody fucked up their daily swap a la Knight Capital“. Which is valid! And which is why I avoid having more than half my portfolio in complicated leveraged instruments, and why I split my LETF usage among both multiple providers and multiple ETFs.
I accept the remainder of the risks, having done what I can to mitigate them.
Enter: The Titanic Portfolio
Is it cringe to give grandiose names to arbitrary sets of tickers? Everyone does it. Still feels cringe, though.

Here are the modifications I want to do to Hedgefundie:
(1) lever it down: because who has the energy, really?
(2) add some other assets for diversification (gold and commodities) at a sufficiently low level where they don’t drag down portfolio performance.
(3) avoid having >50% of my portfolio in complicated arcane leveraged instruments due to counterparty risk (I would prefer not to wake up one morning to a news article saying that someone pulled a Knight Capital in the night and now all the funds are worthless).
Then: METRICS.
Proposed new allocation:

Which gets us nominal exposure equal to, as a percentage of the portfolio’s value:
90% stocks (3x upro)
60% long duration bonds (1x for TLT, 3x for TMF)
30% gold (1x gld)
10% commodities (1x GSG)
This can be improved! In particular, I have specific sector tilts I want to do. But my current theory is that the portfolio allocation between different asset classes ought to be evergreen, since I have no particular expectations about what the future holds in terms of the treasury messing around or the macroeconomic climate more broadly. I *do* have particular expectations about the future around AI; therefore my final true allocation ends up being— instead of 30% UPRO— 10% UPRO, 10% SOXL, 10% TQQQ. Getting us pretty heavy exposure to semiconductors and Big Tech more generally.
But for backtesting purposes that’s cheating.
We *know* semiconductors and big tech did great. For the purpose of determining the evergreen portfolio allocations I think it’s important to strongly restrict our degrees of freedom so we don’t do the traditional stupid backtesting thing of being all like “so I guess Bitcoin did great this last 20 years which means I should invest in that now.“
I also intend to use PDBC instead of GSG, since as far as I can tell it’s a commodity fund that is correlated near-perfectly with it but has reliably better performance. For reasons! Look, it’s like 10% of the portfolio, I’m not gonna overthink it.
Anyway, this is how that hypothetical, revised portfolio would have done:

The red line is Hedgefundie at 50/50 TMF/UPRO. The blue line is our revised Hedgefundie (THE TITANIC). And the yellow line is the S&P 500.
Our portfolio doesn’t actually do significantly better than the S&P 500 *over this specific time period*; this was a lot of effort to get, like, 1% better CAGR, and we gave up a lot in volatility (mostly due to the 2022 crash). What about a longer-term look, using the Simba Spreadsheet?
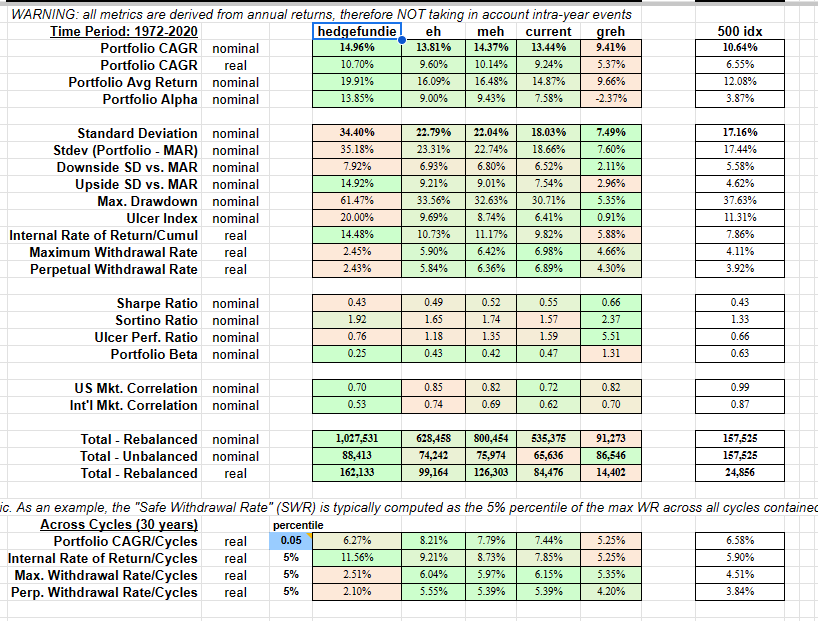
Note that this doesn’t include 2021 to the present day. Also ignore the existence of “eh”, “meh” and “greh.” The portfolio named “current” is the one I’m trying backtesting on here; the portfolio named “hedgefundie” is the 50/50 asset mix.
The interesting thing here is to look “Across Cycles“ graph and note that in the worst 30-year period backtested, we had 7.44% CAGR as opposed to 6.58% for SPY and 6.27% CAGR for Hedgefundie.
The other thing to appreciate here is that, for that second row (Portfolio CAGR in real dollars) hedgefundie looks *much* less appealing than it did at first. I mean, it’s still pretty good— 15% CAGR is great— but the max drawdown of 60% the value of the portfolio is eye-watering. The Titanic above does pretty well at almost 3% CAGR above the S&P 500 while maintaining a max drawdown about half of Hedgefundie. (The ulcer perf ratio is a metric basically revolving around the size and duration of drawdowns, and suggests that this portfolio’s level of drawdowns should be— in most cases— significantly less painful than that of the S&P 500.)
Q: The Titanic portfolio? *Seriously*?
If anyone ever copies this portfolio and things go poorly, I want their complaint to include the fact that the newsletter they got the portfolio from is named “Dubious Advice” and is written by one “UntrustworthyBastard” and that the specific portfolio they were imitating was called the “Titanic.”
Upon uttering this sequence of words I can only assume the complainer explodes spontaneously in a geyser of shame, thereby saving me from the lawsuit.
Q: That longer-term backtest doesn’t include the most recent crash.
Sure doesn’t! Spreadsheet doesn’t have the data for it and I can’t be bothered. Suffice it to say that the Titanic suffers a drawdown of a bit more than 30%, which is a bunch.
Q: I feel as though this portfolio implies really weird inefficiencies in the US economy. Like, if the SPY averages a 10% return in a year and this portfolio can get you 13%, doesn’t that imply that on average a company would do better to divest its holdings and just earn 13% return on a lazy portfolio? Isn’t that an insane, ouroboros setup implying that the core concept of levered portfolios is flawed?
